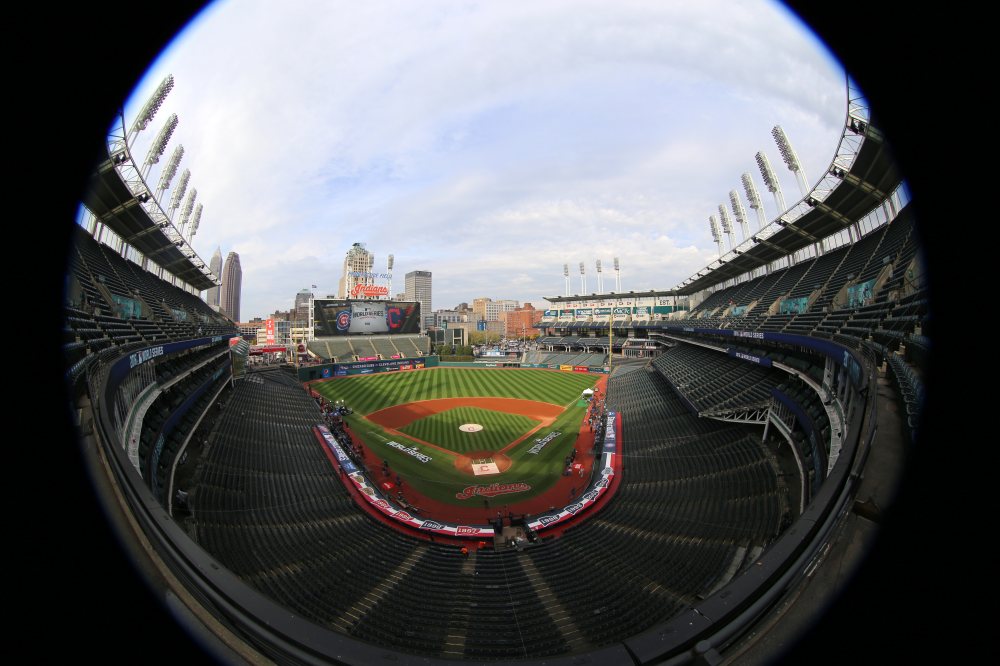

How a camera turns light into a grid of numbers. The pinhole camera and perspective, the camera matrix, lenses and their problems, light and colour, what happens inside the camera, and pixels, levels and colour spaces.
By the end, students can
- Use similar triangles to get the pinhole formula . Use it to explain why far things look small and why parallel lines meet at a vanishing point.
- Turn a 3D point into pixel coordinates with the matrix , and explain what and add.
- Calculate a camera's field of view from its focal length and sensor width.
- Explain why cameras need lenses, and what focus, depth of field and lens distortion are.
- Describe the steps from light to a JPEG file (sensor, Bayer filter, demosaicing, white balance, gamma, compression), and explain why the numbers in the file are not the raw light.
- Explain sampling and quantization, and choose a colour space (RGB, HSV, grey) to find an object by its colour.
Students should already know
- Lecture 1, especially "a picture is a grid of numbers" and "a photo loses distance".
- Similar triangles, multiplying a matrix by a vector, and basic trigonometry ( and ).
How to run this session
This lecture follows one ray of light, from a lamp to a file. At the end, students should be able to do two things:
- Calculate where a point lands in the picture ( and the matrix ).
- Explain that the numbers in a picture file are processed measurements, not raw light.
Everything else supports these two ideas.
Part 1 (geometry) has the only real maths today. The exercise on slide 10 is where students check that they can use it. Protect this time. If you are short of time, shorten Part 3 (light and colour): the statue, colour and gamma slides can each be done in one minute.
| Time | Part | Slides | What happens |
|---|---|---|---|
| 0–8 | Opening | 1–3 | The road question from lecture 1, the path of a ray of light |
| 8–40 | Geometry | 4–11 | Pinhole camera, vanishing points, camera models, , , projection exercise, field of view |
| 40–52 | Lenses | 12–15 | Why we need lenses, focus and depth of field, distortion |
| 52–72 | Light and colour | 16–22 | Shading, colour, inside the camera, Bayer filter and demosaicing, gamma |
| 72–90 | Numbers | 23–28 | Sampling, quantization, colour spaces, live HSV demo, JPEG |
| 90–100 | End | 29–30 | Summary, exit ticket |
Before class
- Practise drawing the pinhole picture (slide 5) on the board. Drawing it live, one triangle at a time, works much better than just showing the slide.
- For the live demo (slide 27): Python with
opencv-python, or Google Colab. Download the photo from/figures/photos/red-umbrella.jpgon this site and save it asred-umbrella.jpg. The code should print0.028. - Optional: make a shoebox camera obscura (a small hole on one end, tracing paper on the other end). Students remember it.
- Optional: ask students to bring their phones. On slide 14 they can look at the focal length and f-number in a photo's details (EXIF).
Background for the lecturer
The pinhole model and its rules
The pinhole camera maps a point in front of the camera to the picture position . A real pinhole makes an upside-down picture. To avoid the minus sign, we imagine the picture plane at distance in front of the hole. All textbooks and software do this.
Two traps that students will meet:
- Directions of the axes. In OpenCV, points right, points down, and points forward. This matches picture rows, which also go down. Graphics software (OpenGL) uses up and backwards. Mixing the two is a common bug.
- Pixel centres. Some libraries say pixel covers the area from 0 to 1. Others say it is centred at 0. The difference is half a pixel. It rarely matters in this course, but it matters for exact measurement.
Homogeneous coordinates, a bit more
A 2D point can be written as any vector , where is not zero. To get back , divide by the last number. Why is this useful?
- The division by distance becomes a matrix multiplication plus one division at the end.
- A shift (translation) also becomes a matrix multiplication ( times ). So a whole chain of steps becomes one matrix.
- We can write points that are infinitely far away: means "the direction ". Projecting it gives . This is exactly the vanishing point of all lines with direction . Mention it if a student asks about slide 6.
The full camera matrix
is a 3×4 matrix. A general also has a skew number in position (1, 2). For all modern sensors it is zero, so the slides show 4 numbers in , not 5. has 3 free numbers (three angles) and has 3. So a normal camera has numbers. If the pixels are square (), it has 9.
Calibration (Zhang's method, 2000): take several photos of a flat chessboard at different angles. OpenCV finds the corners and then calculates and the lens distortion. Functions: findChessboardCorners, then calibrateCamera, then undistort.
Field of view and "equivalent focal length"
. Here is the sensor width and the focal length, in the same units. Phone sensors are small (about 6 to 10 mm wide), so their focal lengths are 4 to 7 mm. Phone makers give the 35 mm equivalent focal length, . It gives the same field of view on a 36 mm wide sensor. "Digital zoom" only cuts out the middle of the picture and enlarges it. This is like a longer focal length, but with fewer real pixels.
Lenses: thin lens and depth of field
Thin lens rule: . For objects very far away (), . That is why the pinhole's and the lens's focal length are the same when the lens is focused far away.
Depth of field gets bigger when the opening is smaller (bigger f-number ), the focal length is shorter, or the object is further away. Phone lenses have tiny openings, so they have a large depth of field. Portrait mode estimates distance (with two cameras or a neural network) and then blurs the background on purpose.
Radial distortion is written as , and the same for . There are also small tangential terms when the lens is not exactly parallel to the sensor. Barrel distortion has . Pincushion has .
Light in one paragraph
A pixel's value depends on: the light (strength, colour, direction); how the surface reflects light (its BRDF, which says how much light coming from one direction leaves in another direction); which way the surface faces; shadows; the lens (vignetting); and the sensor. A perfectly matte surface (Lambertian) looks equally bright from every direction. Its brightness is . Here is its basic brightness (albedo), is the direction the surface faces, and is the direction of the light. The Phong model adds a shiny spot around the mirror direction. These two models are enough for this course.
Colour, briefly
- People have three types of colour cells (cones): L, M and S. Two different lights that give the same three responses look the same. They are called metamers.
- In 1931, the CIE defined standard colour matching functions and the XYZ colour space. The chromaticity diagram shows all colours we can see. A screen can show only the triangle between its three main colours (its gamut).
- White balance changes R, G and B so that a white or grey object looks grey. Under yellow indoor light, raw pictures look orange. In shade, they look blue. Our brain does this correction automatically ("colour constancy").
- sRGB is the normal colour space of the web and most picture files. Its brightness curve is close to gamma 2.2.
The sensor and the camera's processor
- A pixel turns light particles (photons) into electric charge. Usually 50 to 80% of photons are counted. Each pixel can hold only a limited charge. When it is full, the pixel saturates: bright areas become flat white (255).
- Photon noise follows a Poisson distribution. With photons, the noise is about , so the signal-to-noise ratio is . Four times more light gives two times less relative noise. This is why dark photos are noisy, even with a good camera.
- Demosaicing methods go from simple averaging of neighbours (fast, but coloured lines at edges) to edge-aware and learned methods. The coloured lines in the slide's figure come from OpenCV's simple method.
OpenCV's Bayer names are confusing
OpenCV names its Bayer codes after the 2×2 block that starts at the second row and column. So a sensor with red at the top-left pixel (RGGB) needs cv2.COLOR_BayerBG2RGB, not BayerRG2RGB. If a demosaiced picture has red and blue swapped, or a strong colour cast, try the other codes.
Sampling and quantization
Students often mix these up. Sampling chooses where we measure (space). Quantization chooses which numbers we allow (values). Lecture 3 explains sampling with the Nyquist theorem. For quantization, a useful rule: each extra bit doubles the number of levels.
Common misconceptions
"A longer focal length always means more zoom."
Focal length gives the field of view only together with the sensor size. A phone lens marked "26 mm equivalent" sees the same view as a 26 mm lens on a big camera, but its real focal length is about 4 mm.
"The camera measures the colour of the object."
It measures the light that the object reflects under the current light, filtered by the camera's colour filters, and then changed by white balance and other processing. The same object under different light gives different RGB numbers.
"Every pixel in a colour photo measured red, green and blue."
Each pixel measured only one colour. The other two are guessed (demosaicing). Fine coloured patterns can give false colours because of this.
"Pixel numbers are proportional to brightness."
They are changed by the gamma curve and other processing. Twice the light does not give twice the number. For exact measurements, use RAW data or convert back to linear numbers first.
"More pixels always means a sharper picture."
Sharpness also depends on the lens, focus, movement, diffraction and noise. A 50 megapixel sensor behind a cheap lens records 50 million blurry samples.
In-class questions with answers
Why does a tall building look like it is falling backwards in a photo taken from the ground?
Answer
To fit the building in, we tilt the camera up. Now the picture plane is not parallel to the building's vertical lines. So these lines have a vanishing point above the picture, and they lean towards it. If we keep the camera level (and crop the photo), the vertical lines stay parallel.
Two cameras stand in the same place. One has twice the focal length. How are their photos different?
Answer
The longer lens sees a narrower view, and everything is two times bigger. The perspective (how big near things look compared with far things) is the same, because perspective depends only on where the camera stands. Perspective changes only when the camera moves.
A camera shows barrel distortion. Does this mean the pinhole model is wrong?
Answer
The pinhole model is a simplification. Real lenses add distortion on top of it. In practice we use "pinhole + distortion": we measure the distortion numbers during calibration, remove the distortion from the picture, and then the pinhole model works again.
Why are photos taken in the dark noisier, even with a good camera?
Answer
Light comes in small packets (photons), and the number that arrives changes randomly. This is photon noise, about for photons. With little light, is small, so the noise is large compared with the signal (). A higher ISO makes the signal and the noise stronger, so it does not help.
Why can HSV be better than RGB for finding a red object?
Answer
In RGB, a change in brightness changes all three numbers. A red object in shadow and in sunlight has very different RGB numbers. In HSV, the hue stays almost the same when brightness changes. So a hue rule plus a saturation rule finds "red" more reliably under different light. It still fails for very dark or almost grey pixels, where hue is unstable.
Exercises
Exercise 2.1: Projection by hand
A camera has pixels and principal point . It is at the origin and looks along . (a) Where do the points , and land? (b) A car is 1.5 m tall and looks 75 pixels tall. How far away is it? (c) The picture is 1920 pixels wide. What is the horizontal field of view?
Solution
(a) ; ; . (b) , so m. (c) . You can use pixels for both and , because only their ratio matters.
Exercise 2.2: Find a vanishing point
Take a photo of a corridor, a road or railway tracks. Choose two lines that are parallel in the real world. Mark two points on each line in a picture editor. Find where the two lines cross in the picture, and mark it. Then do the same for two other parallel lines with a different direction.
What to look for
If both pairs of lines are horizontal in the real world, both crossing points should lie on the horizon line. Small measurement errors are normal. Ask students which lines gave a stable crossing point (long lines, far apart) and which did not (short lines, or lines that are almost parallel in the picture). A neat way to calculate the crossing point uses homogeneous coordinates: line , crossing point (cross products).
Exercise 2.3: Calibrate your phone camera (homework, OpenCV)
Print or show a chessboard pattern (OpenCV provides one). Take 15 to 20 photos of it from different angles with your phone. Use cv2.findChessboardCorners and cv2.calibrateCamera to find and the distortion numbers. Report , , , , and the reprojection error. Remove the distortion from one photo and compare.
What a good report has
(square pixels). A principal point close to the centre of the picture. A reprojection error below about 1 pixel. A field of view (calculated from ) that is close to the phone's advertised equivalent focal length. Big errors usually mean blurry photos, too few angles, or the wrong chessboard size in the code.
Exercise 2.4: Levels and colour (short coding)
(a) Load any photo, change it to grey, and reduce it to 1, 2, 4 and 8 bits, like slide 25. At how many bits do you stop seeing a difference? (b) Choose an object with a clear colour in one of your own photos. Make an HSV mask for it, like slide 27, and report the fraction of pixels selected. Take another photo of the same object under different light. Do your rules still work?
Discussion
(a) Most people stop seeing steps at 5 or 6 bits on smooth pictures, and earlier on busy textures. Smooth areas (sky, skin, blurry backgrounds) show false edges first. (b) Usually the rules must be changed for new light, especially the saturation and value limits. This shows why rules made by hand break easily, and why learned models (Part II) are useful.
Further reading
- R. Szeliski, Computer Vision: Algorithms and Applications, 2nd ed., chapter 2 (sections 2.1–2.3). Free at szeliski.org/Book. Most book figures in today's slides come from this chapter.
- A. Torralba, P. Isola, W. T. Freeman, Foundations of Computer Vision, the chapters on imaging and the pinhole camera. Free at visionbook.mit.edu.
- Z. Zhang (2000), "A flexible new technique for camera calibration", IEEE TPAMI. This is the method behind
calibrateCamera. - OpenCV documentation, "Camera Calibration" tutorial: the code for exercise 2.3.
Slide-by-slide script
What to say on each slide. The same notes appear in presenter view: open the slides and press S.
- 1
Image formation
Last lecture ended with "a picture is a grid of numbers". Today we ask: where do these numbers come from?
We follow one ray of light: from a lamp, to an object, through a lens, onto the camera's sensor, through some electronics, and into a file.
Why this matters: every method later in the course makes assumptions about how pictures are made. If you understand how a picture is made, you know what we can and cannot get back from it. This is the "graphics in reverse" idea from lecture 1.
The title photo was taken with a fisheye lens. Notice how straight lines bend. We will see why today.
- 2
Last time's question
This is the question from the end of lecture 1. Collect two or three answers before you explain.
Common answers: "because it's far away", "perspective", "that's how eyes work". All are partly right, but none explains it. Tell students: in 15 minutes you will be able to calculate where that point is.
Also point at the poles. In the real world they are the same distance apart. In the picture they get closer and closer. So a picture does not keep distances. It also does not keep angles: the road sides are parallel, but in the picture they make a V shape.
- 3
The path of a ray of light
This is the plan for today. Write the four words on the side of the board. Tick each one when you finish it.
The split is useful, not only for teaching. Where a point lands depends on the camera's position and lens. How bright it is depends on the light and the material. These two are mostly separate. Later methods use this: 3D methods use only geometry, and colour methods use only light.
- 4
Part 1: Geometry
This part has the most maths today. But it is all about similar triangles, which students know from school.
- 5
The pinhole camera
Draw this on the board yourself, step by step. It is the most important drawing today.
- Draw a wall with a tiny hole. Behind it, draw a screen at distance . This is the picture plane.
- Draw an object (an arrow) with height , at distance in front of the hole.
- Draw one straight line from the top of the arrow, through the hole, to the screen.
- Show the two triangles: a big one outside (sides and ) and a small one inside (sides and ). They have the same angles, so their sides have the same ratio.
Say these results out loud:
- We divide by . Twice as far away means half as big in the picture. This is perspective.
- The picture is upside down, because the light line crosses through the hole. Cameras and our brain turn it back. In maths we often put the screen in front of the hole to avoid the minus sign.
- is the focal length. A bigger gives a bigger picture. This is zooming in.
The engraving on the right is a camera obscura ("dark room" in Latin): a dark room with a small hole in one wall. The garden outside appears upside down on the opposite wall. People have used this for hundreds of years. You can make one with a shoebox, or with a dark room and a small hole in the curtain.
- 6
Why parallel lines meet
This answers the road question with three lines of maths. Go slowly.
- Imagine walking along the road. gets bigger, and the point gets further away.
- When is very large, the start point does not matter any more. Only the direction matters.
- The left and right sides of the road start at different places, but they have the same direction. So they go to the same point in the picture.
- For a road straight ahead, the direction is . So the vanishing point is at : the centre of the picture, where the camera is looking.
Check: "Where is the vanishing point of the vertical poles?" Their direction is , so . They have no vanishing point: vertical lines stay parallel in the picture, as long as the camera is not tilted. If you tilt the camera up at a tall building, the vertical lines start to meet. That is why buildings look like they are falling backwards in photos.
- 7
Other camera models
Students only need two models:
- Perspective: the pinhole we just learned. We divide by distance.
- Orthographic: we ignore distance completely.
When is orthographic good enough? When everything is "about equally far away". Examples: a city photographed from a satellite, a face photographed from 100 m with a long lens, cells under a microscope. Then dividing by is almost the same as multiplying by one number.
Ask: "Is a selfie closer to orthographic or to perspective?" Very perspective. The nose is about 10% closer to the camera than the ears, so it looks about 10% bigger. That is why noses look big in selfies, and why portrait photographers stand further back and zoom in.
- 8
From metres to pixels: the matrix K
Two changes from the pinhole formula:
- Units. was in millimetres, but a picture has pixels. So we write in pixels: . For example, a 4 mm lens with 0.0014 mm pixels gives pixels.
- Starting point. Pixel numbers start at the top-left corner. But the centre of the lens points at the middle of the sensor, at pixel . This is the principal point. So we add and .
Homogeneous coordinates, in simple words: we add a 1 at the end of the point. We agree that and mean the same point. To get the pixel back, divide by the last number. Here the last number is , so the division by happens at the end. The benefit: the whole projection becomes one matrix multiplication. We will use this again in lecture 8.
is called the intrinsic matrix ("intrinsic" means "belonging to the thing itself"). It belongs to the camera and lens, not to where the camera stands.
- 9
Where the camera is: R and t
Keep this simple: two steps. First, move the world so that the camera is at the centre and looks forward. Then, project. Do not explain rotation matrices in detail here.
A simple comparison: is where you stand and where you look. is which lens you use. If you walk around the room, only and change.
Mention calibration: finding (and the lens distortion) of a real camera. The usual way: take photos of a printed chessboard from different angles. OpenCV's
calibrateCameradoes this in a few lines. It is exercise 2.3 in the guide. - 10
Try it (pairs, 4 minutes)
Give 3 minutes. Then solve it on the board.
- , . Answer: .
- , . The same pixel! The second point is twice as far, on the same line. This is the distance problem from lecture 1, now with numbers.
- Height in pixels . So , and m.
Question 3 shows how a simple distance estimate works. For example, a car camera can estimate how far away a person is, if it assumes a normal height.
- 11
Field of view
From the triangle: . So , where is the width of the sensor.
The chart is for a sensor 36 mm wide (called "full frame"). Phone cameras have tiny sensors and tiny focal lengths (about 4 to 7 mm). So phone makers write the equivalent focal length: the focal length that gives the same view on a 36 mm sensor. That is why a phone's "26 mm" lens is really about 4 mm.
Simple rule: long focal length = narrow view = things look bigger and flatter. Short focal length (wide angle) = more fits in the picture, but strong perspective.
- 12
Part 2: Lenses
Move on to lenses.
- 13
Why we need lenses
Go from left to right, top to bottom.
- A tiny hole gives a sharp picture, because each point sends light through only one spot. But almost no light gets in. The picture is dark, and the camera's noise is very visible. (If the hole is extremely small, the picture becomes blurry again because of diffraction.)
- A large hole lets in a lot of light. But each point now spreads into a small disc on the sensor: blur.
- A lens gives the best of both. It collects light through a big opening, and bends all the light from one point back to one point.
These pictures are a simulation: blur with a disc that grows with the hole size, brightness that grows with the hole area, and the same noise for all. The exact numbers are only an example.
- 14
Focus and depth of field
Explain with the drawing:
- An object at distance is perfectly sharp on a sensor at distance behind the lens. For mm and m, mm.
- Points closer or further away are sharp in front of or behind the sensor. On the sensor they become a small disc, the blur circle .
- If is smaller than one pixel, the point still looks sharp. The range of distances where this is true is the depth of field.
The opening of the lens is the aperture . Photographers use the f-number (f/2, f/4, f/8…). A bigger f-number means a smaller opening: less light, but more depth of field.
Examples students know: portrait mode on phones blurs the background (small depth of field). Phones fake this: they estimate distance with a vision method, and then blur the far parts. Landscape photos are sharp everywhere (small opening).
Link to vision: the amount of blur tells us something about distance. This is called depth from defocus.
- 15
Lenses are not perfect
Everything in Part 1 assumed a perfect pinhole. Real lenses break this in a few known ways:
- Radial distortion is the most important one for vision. Wide-angle and cheap lenses (dashcams, webcams, action cameras) bend lines outwards. This breaks the rule "straight lines stay straight". So every geometry method (lectures 8 and 11) must remove the distortion first. The formula uses , the distance from the centre of the picture. Calibration finds and . OpenCV's
undistortthen removes the effect. - Fisheye lenses (right, and our title photo) bend lines on purpose, to see almost 180°. They need a different camera model.
- Vignetting and chromatic aberration affect brightness and colour. Near the corners, brightness and colour are less reliable.
- Radial distortion is the most important one for vision. Wide-angle and cheap lenses (dashcams, webcams, action cameras) bend lines outwards. This breaks the rule "straight lines stay straight". So every geometry method (lectures 8 and 11) must remove the distortion first. The formula uses , the distance from the centre of the picture. Calibration finds and . OpenCV's
- 16
Part 3: Light and colour
Say: "Now we know where a point lands. Next: what number is stored there?"
- 17
Surfaces reflect light in different ways
Use the statue to point at each effect:
- Cheek and neck: smooth matte shading. A surface facing the light is bright. A surface turned away is darker. The rule (Lambert's law): brightness ∝ , where is the angle between the light and the surface. A surface turned 60° away gets half the light.
- Small bright spots on the hair and shoulder: shiny highlights. They move when you move your head. Matte shading does not.
- The folds: darker, because little light can get in.
The last line is the key message. It connects to the illusion in lecture 1. One number per pixel depends on four unknown things. So finding the material or the shape from brightness alone is very hard. Methods that try ("shape from shading") add rules like "the surface is matte" and "there is only one light".
- 18
Colour is three numbers
The big idea: colour is not only a property of light. It is what three sensors report. Two different lights that give the same three numbers look exactly the same to us. A camera's filters are a little different from our eyes, so sometimes a camera sees two colours as different (or the same) when we don't. This is one reason why a shirt can look different in a photo.
Fun facts: many birds have four types of colour cells. Some factory cameras ("hyperspectral" cameras) measure dozens of colour bands. This connects to the mango task in lecture 1: ripeness can show in colours we cannot see.
- 19
Inside the camera
Follow the arrows on the slide:
- Lens, aperture, shutter: how much light comes in, and for how long.
- Sensor (almost always CMOS today): each pixel counts light particles (photons) and turns them into electric charge. Gain (ISO) makes the signal stronger, but also the noise. The converter (ADC) turns the voltage into a number, usually with 10 to 14 bits. This is the RAW file.
- The image processor inside the camera: demosaicing (next slides), noise removal, sharpening, white balance (making white things look white under yellow indoor light), a brightness curve (gamma), and JPEG compression.
What this means for vision: a JPEG photo is heavily processed. The numbers are not simply proportional to the light. Phones also add strong "AI" processing. For measuring tasks, engineers often use RAW pictures.
Noise sources to name: photon noise (light arrives in random packets, so dark pictures are noisier), electronic noise, and rounding noise (numbers are rounded to whole numbers).
- 20
One colour per pixel: the Bayer filter
Each pixel of the sensor sits under one colour filter. The usual pattern (the Bayer pattern) has two greens for each red and each blue. Why? Our eyes are most sensitive to green, and green carries most of the detail.
So a "12 megapixel colour camera" measures only 12 million single numbers. Two-thirds of the colour values are guessed from the neighbours. In the right drawing, capital letters are measured and small letters are guessed.
- 21
Rebuilding colour: demosaicing
Filling in the missing colours is called demosaicing. This figure is a real photo (the rim of a red umbrella). We turned it into a Bayer pattern in code, and then rebuilt it.
- Left: each pixel coloured by its one filter.
- Middle: what the RAW file really stores. One number per pixel. The checkerboard texture is the filter pattern.
- Right: the rebuilt colour picture. Look closely at the sharp edges: there are thin coloured lines. These are demosaicing mistakes. They often appear on fine details like text and fabric.
- 22
Gamma: the numbers are not the light
Cameras do not store a number proportional to the light. They use a gamma curve: roughly light to the power 1/2.2. (The exact standard is called sRGB.) The screen does the opposite, so in the end the picture looks right.
Why? With 8 bits there are only 256 numbers. Our eyes notice small changes in dark areas, but not in bright areas. Gamma uses more of the 256 numbers for dark tones. So dark areas do not show visible steps.
A trap for vision: averaging two pixels, blurring, resizing or mixing pictures on gamma numbers is not the same as mixing the real light. Exact methods first convert back to linear numbers. Most libraries ignore this, and usually it does not matter much. But it explains some dark lines around edges in resized pictures.
- 23
Part 4: From signal to numbers
Say: "The sensor measures each pixel. Now: how many pixels, how many levels, and how do we store colour?"
- 24
Sampling: how many pixels?
Sampling means choosing where to measure: one number per pixel, on a grid. Fewer pixels means less detail. At 40 × 26 you can still see it is a cat. At 20 × 13 you can barely tell.
Two points for later lectures:
- Many recognition tasks work well with few pixels. Older face detectors used windows of 24 × 24 pixels. Many classification networks use 224 × 224 pixels. Fewer pixels means faster processing.
- If we sample too coarsely, we do not only lose detail. We can also create false patterns (aliasing): strange stripes on shirts on TV, or car wheels that seem to turn backwards in videos. That is lecture 3.
- 25
Quantization: how many levels?
Quantization means choosing which numbers are allowed. With 8 bits (256 levels), we cannot see the steps. With 4 bits (16 levels), smooth areas (like the blurry background) start to show false edges. With 1 bit, only black and white are left.
Numbers to know:
- Most pictures: 8 bits per colour, numbers from 0 to 255 (
uint8). - Camera RAW: 10 to 14 bits. Medical and science pictures: often 12 to 16 bits.
- HDR and many deep learning programs: decimal numbers (
float).
Tip: change to
float32before doing maths. Theuint8mistake (200 + 100 = 44) is very common. - Most pictures: 8 bits per colour, numbers from 0 to 255 (
- 26
Colour spaces
Look at the R, G and B channels. The umbrella is bright in R and dark in G and B. But some light grey areas (the sky, the wet ground) are also bright in R. With RGB it is hard to say "red" without also catching bright grey.
In HSV, the hue says which colour, and does not change much with brightness. So one hue rule plus one saturation rule (strong colour only) gives the mask at the bottom left: almost only the umbrella. A few small red things are also caught.
Look at the hue picture: in grey areas the hue looks like random noise. Grey has no clear colour, so its hue is unstable. That is why we also need the saturation rule.
Other colour spaces to mention:
- Grey: , weighted by how sensitive our eyes are.
- YCbCr: brightness plus two colour channels. JPEG and video use it.
- L*a*b*: made so that equal distances look equally different to people. Used to measure colour.
- 27
Live: finding a colour
Run this live if you can. The photo is at
lecture.williem.app/figures/photos/red-umbrella.jpg. Save it asred-umbrella.jpg, and the output will match the slide.Points to make while it runs:
- In OpenCV, hue goes from 0 to 179, not 0 to 359, so it fits in one byte. Red is at both ends: near 0 and near 179. That is why we need two conditions joined with
|(or). - How did we choose the numbers? By testing. Print
h[y, x]at a few pixels on the umbrella. Here most umbrella pixels have hue 173 to 176. - The result is a mask: True or False for each pixel. Its mean is the fraction of pixels that are True. This is the simplest kind of segmentation. Lecture 10 builds on it.
- In OpenCV, hue goes from 0 to 179, not 0 to 359, so it fits in one byte. Red is at both ends: near 0 and near 179. That is why we need two conditions joined with
- 28
Compression changes the numbers
JPEG cuts the picture into blocks of 8 × 8 pixels. It keeps the rough content of each block and throws away the fine detail. It also stores colour at a lower resolution than brightness, because our eyes care less about colour detail. Lecture 3 explains "fine detail" with the idea of frequency.
For vision: a model trained on clean pictures can fail on heavily compressed pictures (CCTV, WhatsApp). Training data should have the same compression as the real system. For measuring, or for training data you control, save as PNG (no loss).
- 29
Summary
Ask students to name one thing from each line that could go wrong in a real system. Examples: distortion bends lines; shiny spots look like white objects; demosaicing makes false colours on text; JPEG blocks look like edges; quantization hides dark details.
- 30
Exit ticket
Expected answers:
- 25 pixels from the centre. Twice as far means half the distance from the centre.
- Our eyes are most sensitive to green, and green carries most of the detail. More green samples give a sharper picture.
- Any two of: gamma curve, white balance, gain (ISO), demosaicing guesses, vignetting, noise, JPEG compression, very bright areas that are cut off at 255.
A question for next time: "Why do striped shirts look strange on TV?"
Previous: What is computer vision?